


But before we jump in, let’s give some context to the subject of data – a broad term that is often poorly defined and thrown around loosely. There are two types of data we’ll discuss in this post: quantitative and qualitative.
Quantitative data is numerical and can be analyzed statistically. It’s collected by aggregating the results of product experiments (e.g. A/B tests), compiling existing customer data, or running surveys/polls with close-ended questions.
Qualitative data is descriptive and non-numerical. It’s collected by interacting with (or observing) customers e.g. interviews, surveys, feedback on prototypes/betas/MVPs, customer service requests, and reviews.
What is data-driven product management?
Data-driven product managers make decisions based on evidence and validated learnings, rather than just intuition or guesswork. They collect and analyze data on customer behavior, market trends, and product usage to identify opportunities for improvement and achieve a product-market fit.
Product managers at Railsware use a variety of different tools, techniques, and frameworks to leverage the data at their disposal and make evidence-based decisions. We’ll discuss many of those approaches in this article. But first, a little background on why data is so integral to product management.
Why it’s vital to be data-driven
In 2022, a NewVantage Partners report found that just 56% of businesses are ‘driving innovation with data,’ and less than a quarter have managed to ‘establish a data culture.’
Why? The reasons are nuanced, but one major contributor is that humans aren’t hardwired to be data-driven. We’re prone to subjectivity. And even the most disciplined and experienced product managers are susceptible to bias.
Cognitive biases are errors in our thinking that can affect how we make decisions. Here are some of the most common types:
- Experience bias, also known as blind spot bias. We tend to judge other people’s ideas and opinions more harshly than our own, and believe that our perception of the problem/project/team is the ‘objective truth.’
- False consensus effect. We often assume that our own opinions and behaviors are more widely shared than they actually are.
- Expedience bias. We favor fast thought/decision-making processes over slower, more intensive ones. Nobel-prize winner Daniel Kahneman discusses this theory in his book ‘Thinking, Fast and Slow.’
- Confirmation bias. We are more likely to seek and share information that supports our opinion or vision, than information that challenges or disproves it.
Our biases are unconscious. Even when we’re aware of them, we struggle to mitigate their impact on our work. And when we don’t use objective insights to shape our product strategy, product roadmap, or overall development process, we risk letting those biases contaminate our judgment and jeopardize the project.
Data-driven decision-making is a means of listening to the customer and learning about their wants, needs, preferences, and dislikes. When we use data in both day-to-day problem-solving and long-term strategic planning, it empowers us to build products that deliver value to users.
Product hypotheses
Product hypotheses are a cornerstone of data-driven product development.
A hypothesis is a testable statement that predicts the relationship between two or more variables. In a Lean product development context, we develop and test hypotheses in order to validate assumptions about customer behavior, market needs, competitors, and the expected outcomes of product changes.
How to generate hypotheses and write statements
If you’re not already generating hypotheses during these situations, we highly recommend that you start:
- During/after ideation sessions
- When making product improvements or identifying ways to grow the product
- When making assumptions based on customer feedback
- Problem-solving in general.
There are no strict rules around how to write a product hypothesis statement. But in order to conduct tests and determine if your assumption is valid/invalid, you need to structure your statement properly.
You can use the terms ‘If’ and ‘then’ to define the presumed relationship between two variables. One of the variables should be based on a metric and the relationship between each should be clear and logical.
For example, ‘If we improve the app’s search bar functionality, then more users will start using the feature.’ Or ‘If we add an FAQ section to our website, then we’ll see a decrease in the number of customer service tickets.’ To make your statement even more precise, you can add percentages and deadlines to your expected outcome (e.g. If we add an FAQ section to our website, then the number of customer service tickets will decrease by 10% within two months).
Testing product hypotheses
After you’ve screened an idea or run a backlog refinement session, you will probably have several product hypotheses ready for testing. But it’s not worth your time and resources to test all of them. To narrow down the list, we recommend using the MoSCoW prioritization technique, developed by product marketer Dai Clegg in 1994.


Here are a few of the hypothesis testing methods we regularly use at Railsware.
Qualitative methods:
- Prototyping
- Customer interviews
- Customer surveys
- Reviewing public reviews, etc.
Quantitative methods:
- A/B testing
- Feature flags
- User-wide updates
Evidence-based decisions
We’ve discussed the benefits of running product experiments and how hypothesizing can help you make more informed decisions. This approach is essentially the backbone of evidence-based decision-making. But there’s more to the process than what we’ve outlined. When we’re running discovery sessions, or exploring a new product strategy/creative direction, we’ll often use decision-making frameworks to help structure our thinking and develop out-of-the-box solutions.
Let’s take our BRIDGeS framework as an example. BRIDGeS is a simple, versatile framework for multi-context decision-making. Essentially, it allows us to examine a problem from multiple perspectives so that the solutions we come up with are well-rounded and actionable.
BRIDGeS stands for Benefits, Risks, Issues, Domain Knowledge, Goals, and Solutions. Read about how to prepare, and find the Figma template here.
There are 4 steps to the process:
- Problem description – start in the Problem Space by brainstorming the subject with 2-8 stakeholders. Examine the problem through the lens of each descriptor (Benefits, Risks, Issues). Add any relevant domain knowledge or goals to the board too.
- Prioritization exercise – prioritize all listed Benefits, Risks, and Issues (BRIs) using the MoSCoW technique.
- Solution variations – switch to the Solution Space and develop high-level solutions that respond to the BRIs you’ve described and prioritized.
- Solution breakdown – describe the high-level solutions through epics and nested tasks (later you can transform them into a roadmap for implementation).
For more suggestions on how to structure your ideation and problem-solving sessions, see our curated list of the best decision-making frameworks.
Bear in mind: the quality of your decision-making process rests on the quality of the information that goes into it. That’s why it’s always best to do extensive research on your subject(s) before running a major discovery session. For market research, consultancy firms like Gartner, Forrester, and McKinsey & Co are a few of the best sources.
Ultimately, the simple act of using a decision-making framework won’t help you become more data-driven. But it’s an approach that ties in nicely with other data-driven practices like market research, customer data analysis, and running product experiments.
This takes us to product dashboards – another analytics tool you need to have in your pocket in order to make solid data-driven decisions.
Product dashboards
Product analytics dashboards allow us to visually track product/marketing/sales metrics, quickly access fresh data, and identify issues as they arise. But most importantly, they are decision-making tools. It’s near impossible to make data-driven decisions without having a single location to gather, view, and analyze relevant figures.
To track key metrics, our product managers typically use an adapted version of the AARRR or Pirate Metrics framework. For example, our product funnel dashboards often contain the following metrics:
- Awareness – how many people know about our product (visited the website).
- Acquisition – number of people who signed up.
- Activation – how many people have started actively using the product (measured in different ways).
- Retention – the number of regular users.
- Paid – number of users who made their first purchase.
- MRR – monthly recurring revenue.
For suggestions on other important product metrics to track, see our startup metrics guide.
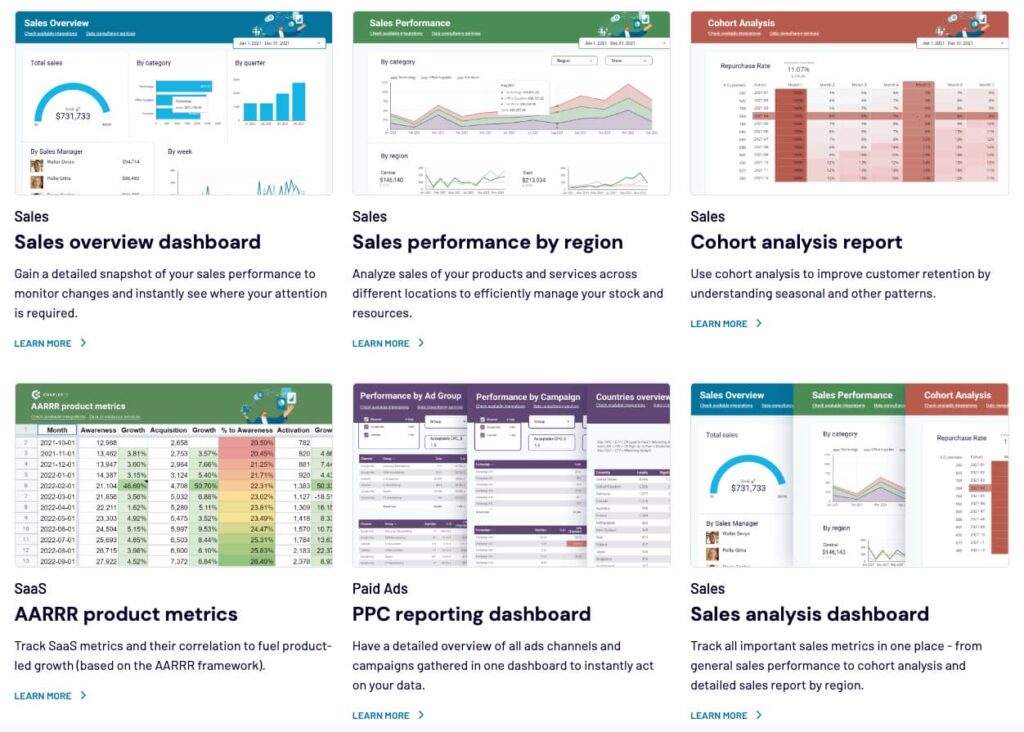
By pulling together data from different sources (product database, analytics service, payment processor) we get a holistic picture of how well the product is performing on the market. The same can be said for other types of product dashboards. Here’s a snapshot of some of the dashboards the team at Coupler.io build for their clients, to give you an idea of how you can track different aspects of marketing/sales activity.

To make data analysis (and decision-making in general) easier, we recommend displaying no more than 8-10 data points per dashboard. And don’t clutter it with data you don’t need (e.g. we don’t track the AARRR ‘referral’ metric because it’s not relevant to most of our products, at least not at the current stage of their life cycles). Basically, if it’s not important to your product’s short- or long-term goals, leave it out.
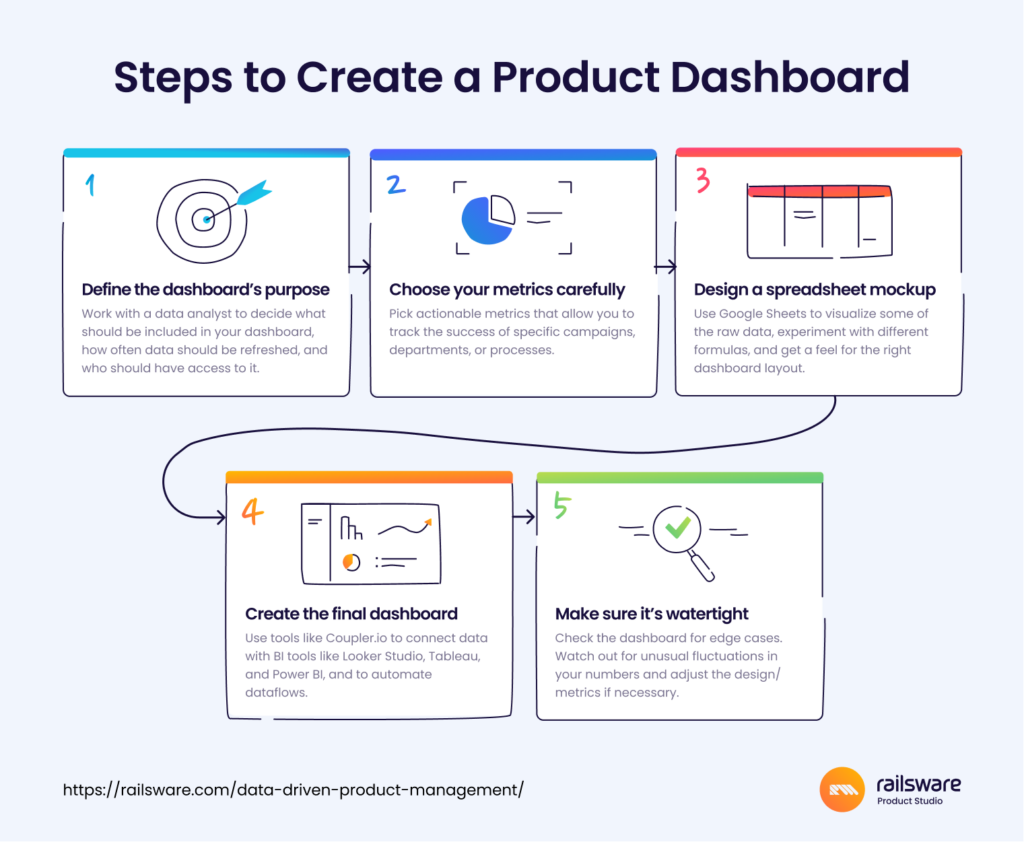
Here are a few of our tips on how to build a dashboard from scratch:

Misconceptions about data-driven decision-making
Data is king
The most important thing to remember when working with data? It’s just another tool in your product management toolbox. And just because the data tells you that something is important, doesn’t mean you always need to act on that information.
Data can’t replace common sense. It can give you clues on what to add, change, or get rid of when building software applications. It can tell you how popular your product is, and alert you to problems. But it never provides the full picture.
For example, a customer survey reveals that a huge proportion of your user base is requesting a certain feature. Market research also tells you that you can slightly increase your revenue by adding it to your product. But it’s expensive to build and you’re low on development resources. So common sense and experience tell you that it’s best to focus on a cheaper, yet high-value feature, and mark the expensive one as ‘should-have’ in your product backlog. The team still knows it’s important, but understands the context around it.
Everyone needs to be data-driven, all the time
Sometimes, product managers become so obsessed with analyzing and following their data, they stop leaving room for creativity. After all, human judgment is flawed, right? Shouldn’t we just skip the brainstorming and stick to the facts?
But stamping out creative collaborations won’t help your team become more focused or pragmatic. To establish a healthy balance, blend ideation and decision-making frameworks (such as BRIDGeS) with data analysis and hypothesis testing. For example, use BRIDGeS to generate a list of possible solutions, develop hypotheses around some of those solutions, test them, and use the results to inform your final decision.
You can’t go wrong with data
We tend to associate having data with having all the ‘facts.’ But not all data is clean, accurate, or relevant. While running product experiments or customer interviews, there are always variables that can affect the integrity of the information you’ve gathered and lead to data bias. For example, you fail to collect enough data, so your results are not statistically significant. Or during interviews, you asked your customers far too many close-ended questions.
Here are a few other common traps you might face when working with data:
- Not paying attention to seasonal factors. If you are unaware of the seasonal patterns in your sales, you may attribute an increase in revenue to a recent change (e.g. newly-added feature, website redesign, etc.), instead of the fact that it’s a time of year when people generally spend more i.e. winter holidays.
- Jumping to conclusions about team performance. For example, you notice that the new customer support manager’s daily ticket efficiency is lower than that of other recent hires. But by digging deeper, you might see that there were simply fewer tickets generated this month. Or that due to the team expansion, each member of the support team now has fewer tickets to handle.
- Not tracking daily metrics. Some months (like February) have fewer days than others, so it’s not always accurate to compare one month directly to the other. Also, the data might differ depending on how many weekends you have in a month. Our advice: don’t freak out over small fluctuations and dig deeper whenever you spot something unusual.
. . .
Now that we’ve discussed some of the basics of data-driven decision-making, let’s look at some other areas of product development where data can be leveraged.
Human-centered and data-driven design
Business consultant Kate Zabriskie once said: ‘The customer’s perception is your reality.’ And this quote kind of sums up what human-centered design is all about – seeing the problem from your customer’s point of view and creating a solution that aligns with their behaviors, emotions, and way of interacting with the world.
According to renowned designer Don Norman, the three core principles of human-centered design (HCD) are:
- Focus on people
- Solve the right problem
- Everything is a system
Essentially, HCD is about empathy, getting to the root of an issue, and paying attention to the bigger picture. We shouldn’t just see our customers as nameless, faceless users, but as people who want to accomplish a goal e.g. improve the efficiency of their projects (Jira), quickly deploy an application (DigitalOcean), or simply end their hunger pains after a long day in the office (UberEats).
We can’t create human-centered products without taking a data-driven approach to design. This involves understanding how customers use your product, and what improvements you can make to it based on those insights.
Data-driven design allows us to create a well-rounded, enjoyable user experience. Designing user flows without the input of data can result in two extremes: overly complicated or overly simplistic user flows.
Testing the app prototype or MVP with a small cohort of potential (or existing) users can provide insight into where improvements are needed e.g. the user wants to change the email address associated with their account, but can’t find their profile, which causes them to leave the app and/or contact customer service. If we see that a significant number of users are experiencing this issue (by monitoring customer service requests, for instance), we know that it’s necessary to make the account profile more visible.
Likewise, not using data to check which features are popular and which are rarely used can lead to feature bloat. The only way to know whether a feature is necessary or not is by checking our usage metrics, running product experiments, or asking users which features they consider most essential. Each new feature should serve a specific purpose and enhance the user experience.
Features prioritization based on data
Let’s imagine your product backlog is full of preliminary ideas for new features, many of which you believe have serious potential and should be developed as soon as resources become available.
At the same time, your CEO or customer service team is urging you to prioritize one or two features that don’t seem as promising. Everyone has their hunches on what should be released next. So how can you utilize data to determine which features your customers actually want?
Gather and evaluate customer feedback
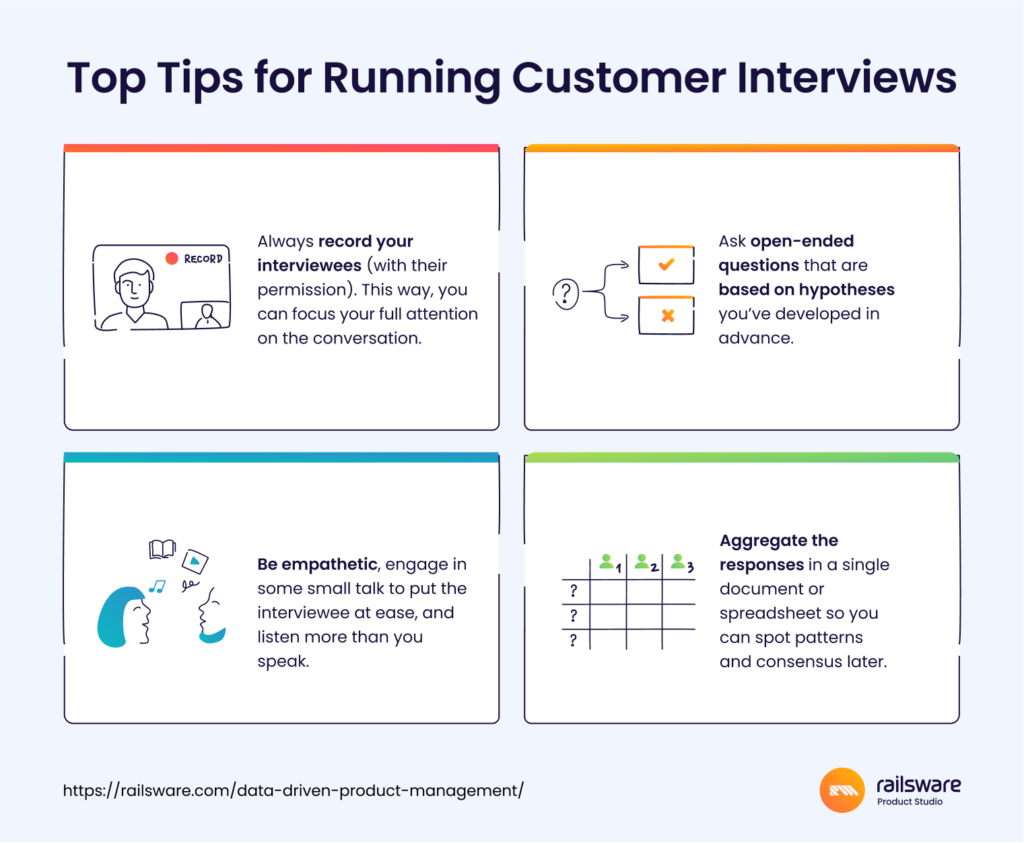
If your backlog isn’t already shaped by data, start by talking to your existing, paying users. Run customer interviews and gather as much information as possible on how they interact with your app, what they like/dislike about it, and what they think is missing (open-ended questions only). Then, aggregate all of this data in a spreadsheet, and search for patterns in the responses. If you see that a large percentage are requesting the same feature, or complaining about the same issue, this can provide clues on which features are most needed. You can also review customer service requests or complaints to identify an area where a new feature is needed.
Examine existing data
Use product dashboards to dive deep into your existing data. Which features are users interacting with the most? What are the habits of your most engaged users? Are there drop-offs in usage after certain app interactions? Regular analysis of dashboards (at least once a week) can alert you to any issues that are simmering below the surface. Investigating those issues (sudden spike in churn, higher bounce rate) might give you insight into which features should be implemented or improved first.
For best results, we’d recommend combining data analytics with a prioritization framework. Use data to create a longlist of high-value potential features, and a framework to generate a shortlist that aligns with your project goals. As we mentioned in the product hypothesis chapter, MoSCoW is our preferred prioritization technique at Railsware. But there are several others you should know about:
- Buy-a-Feature Method
- Kano Method
- Lean Prioritization (Value/Effort Matrix)
- Opportunity Scoring
- RICE Scoring Method
- Scoring Card/Weighted Scoring
- Walking Skeleton
For a deeper dive into each of these techniques, see our post on How to Prioritize Product Features.
Customer data
Now, let’s discuss how to properly manage and utilize your customer data.
A 2021 McKinsey&Co. survey found that 71% of consumers expect a personalized user experience – especially B2B SaaS buyers. But organizations can’t offer personalized experiences without access to clean data, and a lot of it. So in order to grow your product, it’s vital to have a scaleable infrastructure in place and establish clear rules around customer data management.
Data stewardship
Data stewardship broadly refers to the management and protection of data assets within an organization. It’s not directly related to the role of product management – if you work alongside data analysts, data scientists, or analytics engineers, you won’t need to be a ‘data steward’ in the strictest sense of the word. But the guiding principles of this concept can help you have more control over your product data and obtain clearer insights. Additionally, automating database change management for CI/CD integration is crucial to maintaining consistency and reliability in your data infrastructure.
Some things to consider are:
- Creating repeatable and automated processes for data collection, processing, and storage.
- Making sure customer data is properly segmented and organized. Establishing naming conventions for datasets to ensure consistency throughout your database.
- Ensuring the development team follows best practices, including data encryption, network security, protection of sensitive data e.g. personally identifiable information, and having backup and recovery procedures in place.
- Regularly update your customer data so your insights remain fresh and relevant. We recommend using a tool to automate this process, like Coupler.io (more on this later).
- Clearly defining ownership: who’s responsible for data maintenance and which stakeholders have access to certain data assets.
As we said, the majority of these responsibilities likely won’t fall under your scope. But to maintain the integrity of your customer data, it’s important to pay attention to those points.
Data compliance
Regulations around customer data collection and processing vary from region to region. You will probably be most familiar with General Data Protection Regulation (GDPR), which applies to organizations operating and trading within the EU. Non-compliance can result in hefty fines, so consult this checklist to find out what’s required.
Meanwhile, in the U.S., there is no blanket legislation on data protection. Every state has its own set of regulations (including California’s comprehensive privacy act, CPRA). For a quick summary, read this guide to U.S. privacy laws. You can also check for enacted laws, proposed privacy bills, and changes to legislation on the IAPP website.
Note: Some data analytics and collection tools (such as Microsoft Clarity) come with built-in compliance. For B2B companies that regularly need to prove their regulatory adherence to enterprise clients, using an AI tool to automate questionnaire workflows can instantly streamline the vendor risk assessment process and speed up sales cycles.
Toolset of a data-driven product manager
At Railsware, our product managers work closely with in-house data engineers to get the most out of available data. Together they break down data silos, create unique dashboards, and draw meaningful insights from them. But whether or not you have data experts on hand, every data-driven product manager needs their own toolset. Here are a few suggestions:
For collecting key data:
- Amplitude – to track user behavior and interactions (e.g event actions: visits, views, clicks)
- Microsoft Clarity – to track user behavior and interactions (including sessions recordings, heatmaps)
- ProfitWell – to track subscription and revenue metrics.
For managing data:
- Coupler.io – to gather data from multiple sources, connect it to a data warehouse, create automated dataflows, and connect with data visualization tools.
- GSheets – to organize data and create straightforward visualizations of raw data.
- BigQuery – to store, organize, and parse large data sets. Supports GoogleSQL dialect.
- Amazon Redshift – to store data, also uses SQL to analyze structured and semi-structured data.
For visualizing data:
Final thoughts
It takes time, discipline, and teamwork to generate and test hypotheses, conduct customer interviews, create product dashboards, and build a data-driven culture in general. But we believe the effort is worthwhile. Making decisions based on evidence helps to mitigate some of the risk involved in running a startup. Instead of taking shots in the dark – or letting our biases get in the way – we can make strategic decisions with confidence, and increase our overall chances of success.