There are many ways to find and fix bugs manually. However, versatile debugging tools enjoy the largest popularity among software engineers. Moreover, the availability of these solutions is important for any language, technology or framework.
Debugging tools can save hours when resolving defects or problems within an application. React Native is not an exception and offers a set of solutions to optimize a debugging process. Let’s take a look at some of them that we in Railsware often use.

React Native Debugging Tools
In-App Developer Menu
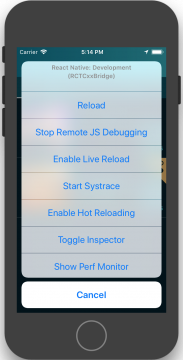
Meet what is probably the first tool that any React Native engineer would opt to use. It’s a built in menu that can be accessed on iOS and Android simulators. It provides a set of functions that are helpful on a daily basis. Some of them deserve particular attention.
“Debug JS Remotely” is designed to debug JavaScript code in the Chrome browser. It opens a Chrome tab and where React Native JS code runs as a web worker inside this tab. The function enables debugging code from the browser, see calls from libraries, console.* statements.
“Toggle Inspector” enables overlay with the following:
- UI inspector showing information about selected UI elements: styles properties, position in component hierarchy.
- Network showing all network activities like API calls to your backend.
- Displays touchable elements. It may be helpful to understand areas for each touchable (in case of a seamless interface) in order to improve UX.
“Perf Monitor” shows system and performance-related information such as memory usage, JSC, script execution time etc.
React Developer Tools
The React Native build-in inspector allows the user to obtain information about elements. Yet, it is functionally limited and is not suitable for navigating elements in the component tree.
React Devtools is not an integrated application, so be prepared to install it. It enables live inspection of components hierarchy, see and change styles similar to Chrome or Firefox Devtools for web apps.
Along with the React Native Inspector, the tool lets you click on something in the simulator to bring up relevant components in DevTools. In addition, you are able to inspect component instances and manipulate its props and state.
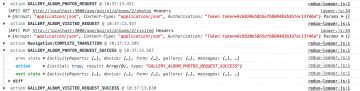
Redux logger
A React Native application (just like any other React app) can be built with Redux. On that account, redux-logger can be used to debug redux actions triggered in the app. It shows the redux state and actions log in the Chrome console.
Redux devtools
Redux-logger enables viewing actions, ordering, and how user’s interactions affect the redux state. However, it’s read-only. Another tool called redux-devtools provides a live-editing environment for redux applications. Besides, it lets you go back in time by canceling redux actions.
It works with React Native applications in combination with remote-redux-devtools.
Use Xcode to debug IOS GUI
Since React Native has native code inside, you are able to use native debug tools. XCode has a decent instrument called Debugging View Hierarchies, Judging from the name, it provides the ability to inspect and review the view hierarchy. XCode pauses the application and shows an interactive 3D model of the currently selected window. The tool is very helpful to fix UI issues that are difficult to detect at once. These include misplaced graphics, pictures, labels or text.
Conclusion
Strange though it might sound, errors/bugs in code make a computer engineer a better developer. Fixing a mistake is like a lesson. The probability of avoiding such an error in the future significantly decreases. We hope that the above-mentioned debugging tools for React Native used by our team in Railsware will help you in your react native app developing undertakings.