What is the RICE framework?
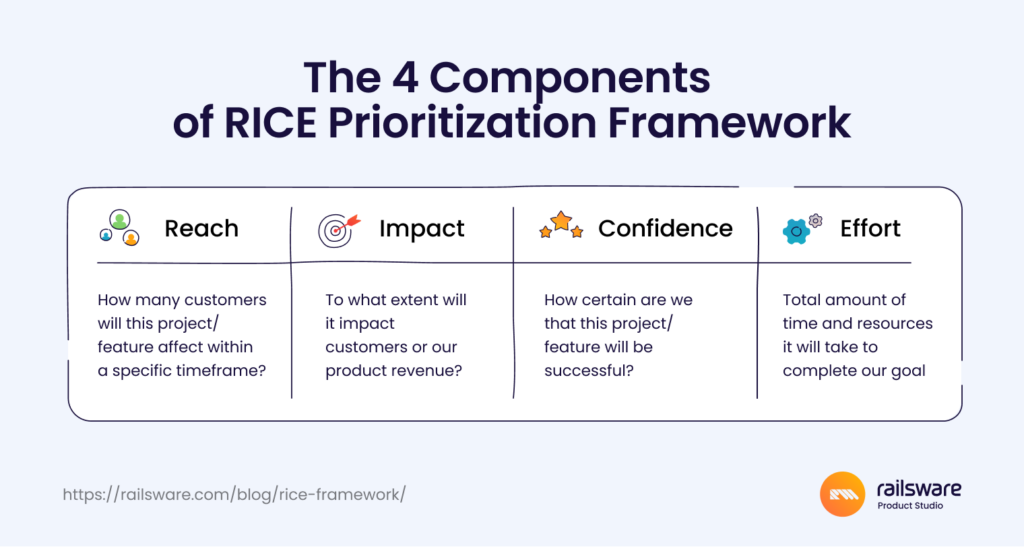
The RICE framework, aka the RICE Scoring Model, is a prioritization framework popular with product, marketing, and growth teams. RICE is an acronym for Reach, Impact, Confidence, and Effort – four factors that determine a prioritization score.
The framework was developed by Sean McBride, former product manager at Intercom. After struggling with the ‘mental minefield’ of product roadmap prioritization, McBride designed a scoring system that would allow teams to ‘compare different ideas in a consistent way.’
Indeed, RICE is one of the most robust, data-driven prioritization frameworks for product development teams. That said, it’s easy to apply RICE to other contexts and functions, such as resource allocation or marketing and content planning.
Four factors of RICE prioritization
To explore each RICE factor in more detail, let’s imagine we’re prioritizing a product roadmap for a fictional product: a SaaS payroll management platform for small businesses. We’ll start by explaining each factor and then discuss how it relates to the product.
Reach
Reach is the first factor we consider when prioritizing with RICE. It refers to the number of users or potential customers who will be affected by the project/feature/initiative within a specific timeframe (monthly or quarterly).
According to McBride, reach helps mitigate bias within the team. It ensures we don’t give preference to ideas that will only benefit a small, insignificant portion of our userbase. Or elevate ideas that we think are ‘cool’ but aren’t grounded in our customers’ needs.
Example
So, to calculate reach, let’s say our payroll platform has 1,500 monthly active users and we want to release a new feature – employee self-service portal – to our paying segment, who comprise 40% of that total (600 users). We also have to account for potential customers who may use it in the future (say, 25 more per month, based on current trends). We’re measuring reach over a quarter. In this case, our reach score is 600 x 3, and 25 x 3, so 1875 users.
Impact
An impact score quantifies the positive effect this new feature or initiative could have on your users. Essentially, it helps answer the question: how will this idea help move the needle on X product goal?
Impact should be linked to a product metric or goal. Ideally, you’ll have the same goal for all the ideas on your list (such as, ‘increase MRR to 30K’). This will make impact calculation and comparison easier. But it’s not necessary to limit yourself to a single goal or metric, especially if they are connected (e.g. increase conversion rate of free to paid accounts and grow MRR by X amount).
To make impact assessment simple, McBride designed a scale from 0.25 to 3. Here’s how it works:
3 – Massive impact
2 – High impact
1 – Medium impact
0.5 – Low impact
0.25 – Minimal impact
Example
Back to our payroll platform. We might give the employee self-service portal feature an impact score of 2, because our main goal is to increase retention (particularly among paying customers). Based on research and existing user data, we think this new feature would be readily adopted by customers.
Confidence
Estimating confidence is all about answering the question: how certain are we that this idea will be successful? McBride says it’s particularly helpful for when you ‘think a project could have a huge impact but don’t have data to back it up.’
A confidence score forces us to think critically about each idea on our list. Yes, it’s an innovative idea, but will it actually help us achieve our main goals?
We can use percentages to measure confidence:
100% – High confidence
80% – Medium confidence
50% – Low confidence
< 50% – Wild guess
Example
For our employee self-service portal feature, we might assign a confidence score of 80%. We’re pretty sure this feature will be a hit – CustDev research shows that our users want their users (employees) to become more self-sufficient. We also know that it’s a common feature on the market, our competitors have it, users have requested it, and we have the budget for it. So, we’re quite certain that this feature will bring value to paying customers and increase retention.
Effort
The last factor in the framework is effort, which represents the potential cost of delivering this new feature, project, or initiative. We calculate effort to ensure that the value of creating X feature outweighs the cost.
Effort is an umbrella term for manpower, company time, and other strains on resources. But there’s no need to do any detailed forecasting here. Instead, McBride proposes to measure effort in ‘person-months’ ie. the work that can be completed by one person in a month.
Example
Let’s estimate effort for our employee self-service portal feature. Since it’s not a simple addition, and requires a good deal of planning, design work, and development, we’ll give it a score of 4 person-months.
How to calculate a RICE score
Once you get to the calculation stage, all the heavy lifting has already been done. You just need to use the RICE formula – (Reach x Impact x Confidence) / Effort – to generate a total score.

You’ll then add that score to your RICE prioritization document. At our software agency, teams have used various collaborative tools to document RICE exercises, including Google Sheets (plain but effective), Coda.io, and Confluence.
But your choice of tool doesn’t really matter here. What matters is having a single doc where all of your scores are recorded and reviewed (it might even make sense to build it into your roadmap).
For a quick start, we’d recommend making a copy of Intercom’s RICE template.
Now, let’s get back to our payroll management platform example. Here, we’ve visualized it alongside a few other ideas that our fictional startup was prioritizing. It should give you a sense of what your doc will look like, and how easy it is to compare scores.
| Idea | Reach | Impact | Confidence | Effort | RICE Score |
|---|---|---|---|---|---|
| Employee self-service portal | 1875 | 2 | 80% | 4 | 750 |
| Document templates for HR-related tasks | 450 | 2 | 50% | 2 | 225 |
| Clockify integration | 2000 | 3 | 100% | 1 | 6000 |
| Custom report generator | 1200 | 2 | 80% | 2 | 960 |
Pros and cons of the RICE framework
Every project management framework or scoring model has its strengths and weaknesses, and RICE is no exception.
Pros
- Highly structured. RICE is essentially a jumbo math equation. By summing three factors, and dividing by another, we get a clear, quantifiable result. This input-output model is what makes the framework so logical, versatile, and consistent.
- Encourages data-driven decision-making. Moreso than other frameworks, RICE relies on quantitative data to calculate a final score. Ideally, you’re using metrics and real numbers to come up with estimates, instead of making guesses or letting biases go unchecked.
- Measures tangible impact. RICE is great for estimating a project/feature’s impact on key metrics like revenue and customer retention. It allows for better alignment between the item being prioritized and your product strategy.
Cons
- It takes time. It’s an exercise that requires prep work (research and data analysis), calculations, and collaboration with team members/other internal stakeholders. It’s not like it takes hours to do, but it’s more time-consuming than say, Dai Clegg’s MoSCoW method (more on that later). Using scraper API, Google extensions, cloud-based automation software, and others can help speed up this process.
- Can be misleading. Working with all of these numbers can make it feel like your prioritization process is super data-driven. While RICE is certainly more data-focused than other frameworks, scores are still just estimates – not solid indicators of future success.
- RICE emphasizes business value. You’re encouraged to lean on existing product metrics or market reserach to estimate scores and prioritize according to business goals. In that sense, it’s harder to understand where more nuanced data, like customer feedback and requests, fit into the equation. Other frameworks, like the Kano model, put a stronger focus on the value an idea could deliver to customers.
When to use the RICE framework
- You have a lot of unknowns. Let’s say your team is exploring new opportunities or planning to change product strategy. RICE’s clearly defined parameters allow you to analyze each unfamiliar idea in more detail before giving it a spot in your new roadmap. The confidence factor also comes in handy here – instead of ignoring your doubts, you can incorporate them into your RICE scores, and then check the list for the least risky options.
- You have a steady influx of ideas from different sources. In this case, it’s difficult to understand which ideas deserve the team’s attention and how soon they should be implemented. Measuring impact helps you pinpoint the best ideas (from a product growth perspective).
- You have limited resources. RICE strives to give you more precise estimates than other frameworks. It’s useful when you have resource constraints and need assurance that you are allocating labor/money/time to the right projects.
Railsware’s experience with the RICE framework
Here are a couple of instances where our teams used the RICE framework to plan marketing campaigns and product experiments.
TitanApps marketing case
A short while ago, our TitanApps marketing team used RICE when they were exploring new marketing directions for our product, Smart Checklist. Their core goals were to increase MRR and grow blog and website traffic.
The team measured each RICE factor on a scale of 1-10 (except confidence, which went from 0-1). This was more convenient than the traditional method and sped up the overall process.
They had a list of ideas and assessed each one in turn. Before using the framework, some ideas appeared more promising than they actually were. Take the idea we had about ‘influencer marketing,’ for example. It’s a popular tactic these days, and yet our RICE score was 2. Clearly it didn’t align well with our goals. RICE showed us that other, less assuming ideas, like updating website copy/messaging (7) and creating website use cases based on keywords (4), were much better options.
Besides the RICE factors and scores, our prioritization table included fields like Goal, Notes/Links, Status (Done, In progress, etc.), and Results. We’d recommend following a similar structure, so that you can track progress after prioritization and directly compare results to previously defined goals.
Mailtrap product experimentation case
Our product team at Mailtrap also tested an adapted version of RICE at one point. We called it F+RICE, where F stands for product funnel.
A little context: the Mailtrap team was prioritizing product experiments, and wanted to better understand where each idea stood in the AARRR product funnel: acquisition, activation, retention, referral, and revenue.
Using this additional factor to classify ideas provided more clarity to our team during and after the prioritization exercise. For instance, if an idea had a relatively low RICE score, but it was classified under revenue, it might still be worth prioritizing over a safer idea involving customer acquisition.
In the end, a couple of ideas with high RICE scores failed at the testing stage. For instance, we assigned high confidence (90%) and high impact (3) to an experiment ‘fix scroll problem by shortening pricing page.’ However, we didn’t get the desired results. These negative outcomes highlight the fact that RICE, or even F+RICE, isn’t foolproof. Further testing of ideas is a must.
Side note: Like in our last example, our team included two extra columns in the doc: Problem and Assumption. We also had a ‘funnel value’ column, where we could rank the importance of stages. This was specific to our hypothesis testing case and helped us keep the ‘why’ behind each idea in mind.
Our tips for effective RICE prioritization
Involve your team in the process
RICE isn’t an activity PdMs or other managers should do in isolation. To develop well-rounded, data-informed scores, it’s critical to get input from your team.
For real-time collaborations on roadmap prioritization, you should invite a few different specialists, like a product designer, engineer(s), senior stakeholder, and even marketing or sales specialists (depending on the project/features in question). Utilizing project management software can help streamline this process and keep everyone aligned. It’s also a good idea to consult the data analytics team when you’re having trouble gauging confidence scores.
On a similar note, make sure everybody knows how RICE works before you jump into a prioritization session. Misunderstandings can cause unnecessary delays and thwart the final scores.
Don’t trust too much in the scores
Again, RICE is just a handy estimation tool – not a silver bullet for product forecasting. Be careful not to put too much stock in the final scores. Ideally, you’ll conduct further testing (e.g. PoC, prototype) anyway, and not rely on the score alone to predict a project/feature’s success.
Some stakeholders – particularly those who didn’t participate in the prioritization exercise – might be confused when high RICE scores lead to failed experiments. From their perspective, RICE can look like a data-driven experiment in itself.
Again, that’s why it’s important to manage expectations from the start, and ensure everyone understands the framework’s limitations. It can be helpful to embed a brief explanation of each factor, and links to RICE guides (like this one!), in the prioritization doc.
What are the best RICE alternatives?
ICE framework
The ICE framework, which stands for Impact, Confidence, and Ease, was developed by Sean Ellis, founder of GrowthHackers. While it might look like ICE is just a shortened version of RICE, there are subtle differences between the two frameworks.
ICE’s factors – Impact, Confidence, and Ease (replaces Effort) – are often measured on a scale of 1-10. The calculation formula is also shorter: (Impact x Confidence) / Ease.
ICE is most popular among marketers, although it can be useful for product teams that don’t have their objectives tied to reaching a broad audience. This might be the case when you’re building features that are only meant for a small cohort (a common occurrence in B2B SaaS). Let’s look at a real-life marketing example from our Coupler.io team.
Mini-case: Why our Coupler.io marketing team used ICE
The Coupler.io marketing team recently used ICE when exploring options for external partnerships. The team’s goal was to increase brand awareness and ultimately boost customer acquisition. Their list of ideas included content co-creation, influencer partnerships, and loyalty programs.
The idea that got the highest ICE score, though, was referral partners i.e. an affiliate marketing program. In this case, the team used ICE instead of RICE because it was more important to measure impact (getting more paid subscribers) and ease of delivery than ‘how many people can we reach?’ Essentially, we wanted to measure the quality of potential leads, rather than the quantity.
The MoSCoW method
The MoSCoW framework was created in the mid-90’s former Oracle PdM, Dai Clegg. Over the past 30 years, it’s become one of the most widely adopted prioritization frameworks in the product development world.
MoSCoW is an acronym and stands for Must-have, Should-have, Could-have, and Won’t-have (the o’s were added for pronounceability). When prioritizing the product backlog or screening a list of new ideas, we simply assign them a letter from the MoSCoW scale.
- Must-have: Top priority items; the project cannot move forward without them.
- Should-have: Ideas of high priority that can be shelved if necessary.
- Could-have: Ideas that we’d like to implement, but they are more ‘nice-to-have’ than essentials.
- Won’t-have: unimportant, costly, or overly complex ideas that we’ll get back to another time.
We should mention – MoSCoW is our preferred prioritization framework at our software agency. We like RICE, but we love the sheer simplicity and versatility of the MoSCoW method.
Those are our main recommendations, but here are a few other popular frameworks you may want to experiment with:
- KANO model
- Lean prioritization (Value/Effort matrix)
- Opportunity scoring
For a list of each framework’s pros and cons, as well as visualizations, check out our comprehensive guide to feature prioritization.
Final thoughts
Like any other product management framework, RICE has its naysayers. And we can’t say their criticism isn’t valid. But our product teams have experimented with a ton of different frameworks and approaches over the years, and RICE is one that we keep coming back to.
To recap, that’s because it’s:
- Easy to use, once you understand each factor and how each relates to your product/project goals.
- Versatile, can be applied to prioritization exercises across functions (product management, marketing, engineering, etc.)
- Detailed and data-driven, letting us connect each prioritized item with real product metrics and team predictions.
Interested in learning more about how we develop products at Railsware, and how we could help your team with prioritization and more? Head over to our product development services page.