
Introduction
New Relic has become an industry standard for web applications performance measurement in Rails community.
Simply adding and configuring newrelic_rpm gem for your Rails application gives you a great overview of its performance with an adequate level of details.
There are still a few improvements you can do to make use of some cool and extremely useful features of New Relic monitoring. They will help you to save time and efforts when fixing performance issues, scaling application, refactoring, etc.
So what should you do to make fast and effective use of New Relic?
Record your deploys
Always record deploys with your capistrano or chief scripts. This will save you time when looking for reasons for performance improvements or drawbacks.
A detailed information about recording deploys using capistrano can be found in official documentation. You can also use simple API deployment notification described here.
Either way it is important to add a clear description of deploy along with a tag or branch name.

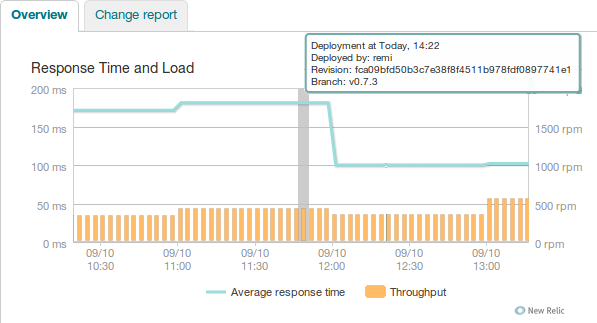
Note that Pro users can also see ‘Change report’ for each deploy with a detailed overview of performance metrics changes (response time, throughput, apdex etc.).
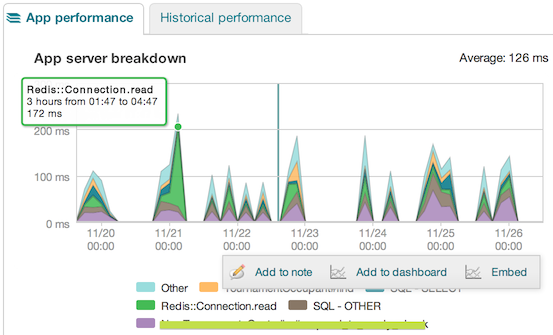
Setup additional metrics before you start
It is important to setup some additional custom metrics right after configuring and enabling New Relic before you have experienced performance issues. You can read more about custom metrics collection here.
While you can add traces to almost any method in your code, they are commonly used for tracking important/critical parts of your code. We strongly recommend you to add traces for:
- application critical parts of code;
- external services communication (redis, RPCs, external APIs, DNS resolve etc.);
- encoding/decoding methods (some json encode methods implementations can be slow for large objects).
These traces are useful even within internal network. Drawbacks may be caused by network lags or hosting provider problems.

Here are some useful examples of custom traces that you can easily add to your initialisation pipeline (e.g. application.rb).
Resque
Resque.add_method_tracer :enqueue
Resolv::DNS
Resolv::DNS.add_method_tracer :open
Resolv::DNS.class_eval {add_method_tracer :getresources}
Redis
Redis.class_eval {add_method_tracer :set}
Redis.class_eval {add_method_tracer :get}
Redis.class_eval {add_method_tracer :sadd}
Redis.class_eval {add_method_tracer :lpop}
Redis.class_eval {add_method_tracer :rpush}
Redis::Connection.class_eval {add_method_tracer :read}
Redis::Connection.class_eval {add_method_tracer :write}
Redis::Connection.class_eval {add_method_tracer :connect}
Setting up additional metrics have two main goals:
- measuring performance of specific parts of code;
- when investigating slow requests with a lot of ‘Application code’ segments these additional traces can be used as benchmarks.
Additional metrics will give you more detailed view of what and when is going on in your application.
Note: New Relic gem implementation already has traces for Net::HTTP methods.
Caution: Don’t be zealous on adding custom metrics, clean obsolete ones.
Collecting too many metrics can impact the performance of your application. It is strongly recommended to keep the total number of custom metrics under 2000.
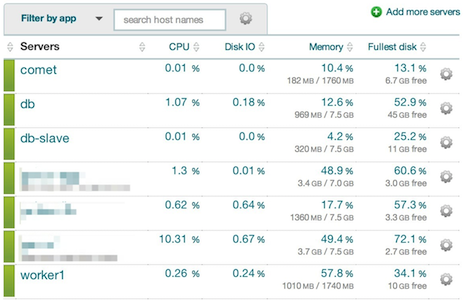
Setup Server Monitoring
To look beyond application itself New Relic has introduced Server Monitoring tool.
It is critically important to setup Server Monitoring for all servers in production and even staging hosting scheme. It will help you to measure your environment performance and state.
Note. New Relic is including Server Monitoring for free for every subscription level.
You can find all required information about installation and configuration of Server Monitoring tool here.

Setup custom views and dashboards
In most cases application performance strongly depends on application state and users activity. It is also helpful to see how your application performance correlates with business metrics, database activity, internal services state etc. New Relic gives you an opportunity to setup custom metrics, group and organise them with views and dashboards.
Common useful custom metrics you should define for your applications are:
- number of active users;
- users activity metrics;
- number of active application’s core entities (e.g. active tables for poker application);
- number of connections/calls for internal/external services (some have specific thresholds);
- database additional metrics.
Official documentation will help you to find more about creating and managing custom views and custom dashboards.

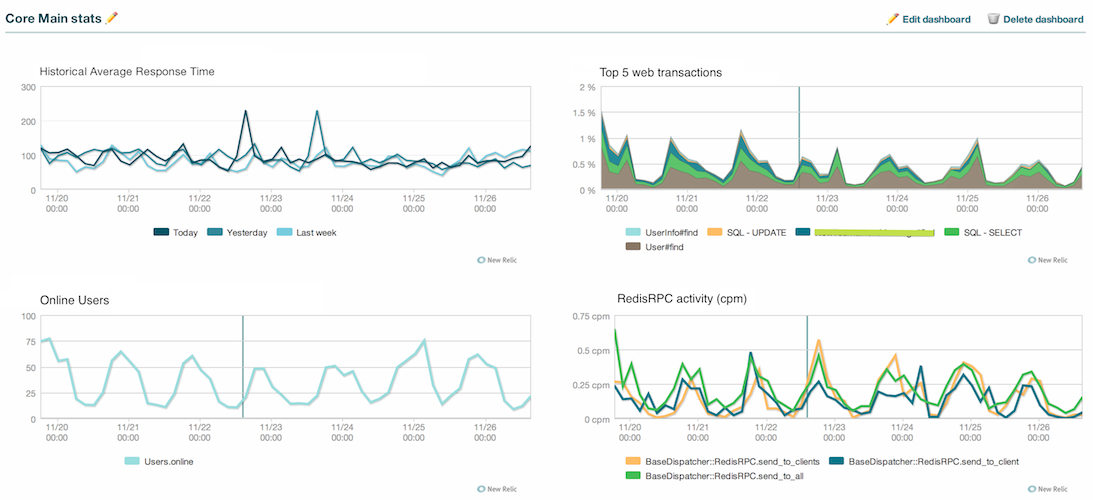
You can collect any custom metric and setup a specific custom view/dashboard in order to have general view on how they correlate.
Along with monitoring, custom dashboards and views also:
- helps you to understand the reason of performance changes;
- gives you a vision of future load changes depending on custom metrics;
- provides an ability to predict critical thresholds for load values (e.g. active users);
- helps you to improve application architecture by showing bottlenecks of internal infrastructure.
Note: The Custom Dashboards feature is available with New Relic Pro and higher.
It is useful to track only those custom metrics that have impact on overall application performance.
Setup background jobs/tasks monitoring
Always trace your background jobs performance. While in most cases they doesn’t directly impact on server response time they still can impact on user’s feedback and overall application performance.
Currently the Ruby agent supports only Delayed::Job and Resque.
Read more about monitoring Ruby background processes and daemons here. Make sure you have enabled and configured everything correctly.
Within one of our products we have employed an actor based architecture where actual action is executing asynchronously in a separate thread (we use JRuby).
In such complex cases, it is useful to add traces for these actions and mark them as real web transactions (controller actions).
To complete such tasks or customise your add_method_tracer options please check API documentation.
For more detailed information about available options please read perform_action_with_newrelic_trace API documentation here.
The most important options of tracer methods are:
- :category — defines action type (available options: [:controller, :task, :rack, :uri]);
- :name — action name (will be used as last part of metric name);
- :params — call context parameters;
- :class_name — first part of metric name. Default is a current class.
Here is a small example of custom background task implementation using JRuby thread actors.ApplicationController:
def enqueue_task(opts={})
  job_params = {
    class_name: "Scheduler::#{self.class.name}",
    name: params[:action],
    params: params
  }
  Scheduler.enqueue(job_params) {yield}
end
Scheduler::WorkerActor:
//job_params are stored in job.params after enqueue
def process_job(job)
  perform_action_with_newrelic_trace(job.params) do
    run_job(job)
  end
end
So in this case all enqueued tasks and controller actions appear in ‘Web transactions’ together.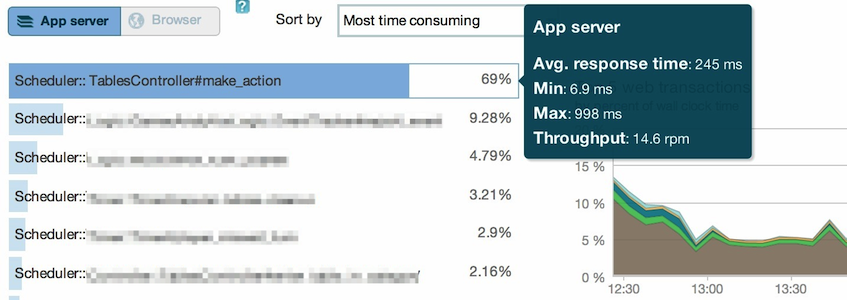

Summary
New Relic is a solid monitoring solution, especially for Rails developers.
Make sure you have enabled and configured all basic features described in this article.
And moreover — always learn your tools.