This is the story of usage and support of Coupler.io, a service which initially was a Google spreadsheet add-on which imports data from shared view of an Airtable table into a spreadsheet, including hourly automatic re-import.
In a nutshell, it was a small and simple plain JS application that uses a proxy server which makes requests to Airtable using a private API and then sends data to the add-on which inserts the data into a spreadsheet.
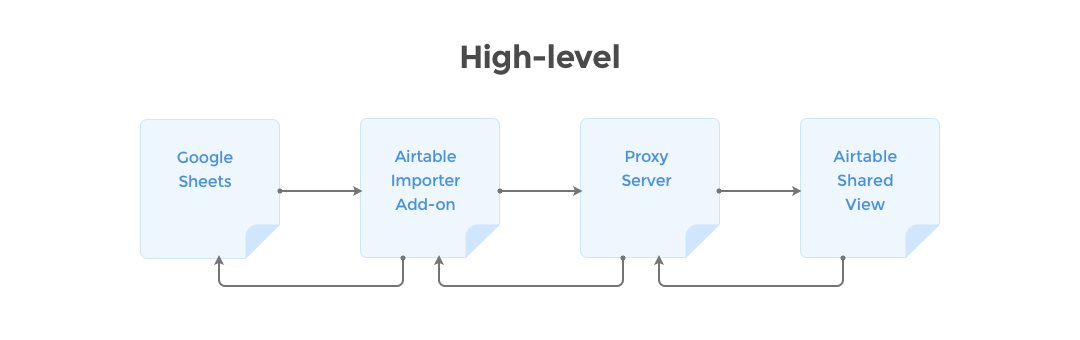
In its turn, the proxy server (our main character) is a NodeJS app sitting on a single Hobby Heroku dyno (512 MB RAM). It utilizes PhantomJS as a browser in order to get data from Airtable. But principle of server operation and private API usage (why not public) deserves a separate story.
This ecosystem existed there for more than a year in a relative tranquility and peace. The add-on has never been heavily promoted and thus never highly popular. However, the Google Web Store built-in search, the add-on uniqueness (so far it’s the only add-on for Google Spreadsheets) and a few forum posts here and there have done their job: according to Google Web Store stats, the add-on has grown by 20-30 users per month and now it’s at about 600-700 installations and ~100 daily users. In addition, hourly automatic imports are processed without any user interaction so the real load could be bigger than user number.
What was wrong
With that said, we found ourselves in a situation when hourly peaks of server activity periodically caused vast memory limit excession, app crashes, server downtime and, as a result, add-on malfunction.
Thankfully, having Drift set up allowed users to inform us about app errors within minutes, so manual dyno restart solved the issue time after time.
Expectedly, with slow but steady users’ inflow this was going to get worse. Additionally, a good half of our users are from US so we had to sacrifice our sleep in order to be able to quickly restart dyno for them in case of crash.
So, after regular manual restarts we thought about extending hosting resources in order to get rid (or at least, reduce) of necessity of manual intervention.
Done, dyno was switched and we expected to get a sigh of relief. But as they say, if you want to make the gods laugh, tell them what your plans are.
Right after restart, the app started crashing and we couldn’t manage to get it back up. Numerous manual restarts didn’t help and app kept crashing for no obvious reason.

Pic.1. Heroku metrics for the incident.
H10: “App crashed”. H12: “Request timeout”. H13 “Connection closed without response”.
R14: “Memory quota exceeded”.
Barring the occult explanation that we had somehow awakened ancient evil and now all hell had broken loose (and we weren’t ready for that: no IDKFA, no megahealth..), we had no clear understanding of what happened. First, we tried to get things back to their old state (if it works, don’t you touch it ©) but that had no effect. The app kept crashing even more frequently.
As we said before, we had a pretty good connection with the users, so their reaction was immediate: tens of notifications, emails and slack messages: “Hi, I’m getting an error Error: request failed…”.
You probably would ask “But usage is small, it’s a free add-on, so you can just leave it and get back to it when there’s time”. Probably, but from previous experience we knew that all the users we had were actually active users. We got a decent amount of feedback saying “You made life much easier at my company with this!”. So we knew people’s work depended on daily usage of the add-on and we had to bring it back up not to let our cozy user community down.
Solution process
The first thing we blame was memory leak. As Pic.2 shows, the app ate as much memory as it was given, no matter the numbers. Even when we upgraded the dyno and restarted, it was still consuming all the available memory at the next activity peak and then returning to a non-responsive state accompanied by errors R14 (memory quota exceeded) and H10 (app crashed/Heroku deployment error).

Pic.2. Memory usage during the incident.
Dotted line shows dyno memory limit.
The next step was to outline what exactly was consuming the memory. So we installed New Relic to get a better picture of how the memory is consumed. We wanted to figure out the ratio of memory consumption by the NodeJS server itself and by PhantomJS respectively. It turned out that browser processes consumed most of the memory and thus resulted in memory leak.
Replace PhantomJS with a headless browser (Google Chrome)
The first thing we tried to do here is to update NodeJS and app dependencies hoping that newer versions would solve the issue. This didn’t pan out, in fact, it made things worse.
So our one and only suspect at this moment was the PhantomJS browser emulation.
By that time we had learned that PhantomJS is well known for leaking memory and it’s also no longer maintained, the main contributor advises switching over to headless Chrome. That’s what we did. We switched from PhantomJS to puppeteer — an official NodeJS library which provides a high-level API to control Chrome or Chromium over the DevTools Protocol. That made things even worse since more memory was needed… and it required an additional buildpack to be run on Heroku. We successfully used Puppeteer Heroku Buildpack which was created to support puppeteer. There is another one for Google Chrome made by Heroku but it caused some other errors we didn’t want to deal with. If you have never used buildpacks before, they are used to enhance a dyno through code, so they can be used to install native libraries, run scripts, etc. (official docs)
Increase size limit of requests in DevTools
The next step was request size. We noticed that some requests were too big to get through. By default DevTools can handle requests of up to 10MB but some of the server’s requests surpassed that limit causing yet more app crashes.
After some reading here and there we learned it could be increased using an experimental feature. It worked, but… well, memory usage increased even further as you might expect.
Handle request outside of browser
Which got us thinking… what if we could make the big request outside of the headless browser? We have achieved this by installing a request interceptor to intercept XMLHttpRequest. Its url and headers are passed by the browser and handed over to a NodeJS server to execute the request and provide a response straight to the add-on.
// enable interception
page.setRequestInterception(true)

const closePage = () => {
  page.removeAllListeners();
  return page.close();
};

page.on('request', (interceptedRequest) => {
  // we are interested in one specific request
  if (REQUEST_URL_PATTERN.test(interceptedRequest.url)) {
    interceptedRequest.abort();

    return closePage()
      .then(() => (
        resolve({
          url: interceptedRequest.url,
          headers: interceptedRequest.headers
        })
      )
      .catch(reject);
  }

  interceptedRequest.continue();
});
Finally, we started to make things better:
- Playing with the DevTools request size limit was no longer necessary
- Potential requests downloading images coming from data were eliminated
- Browser resources were better spent as it could handle more parallel requests utilizing the same amount of memory.
Share browser instance
But we were not done yet. The next idea we had was to share a single instance of a browser and not to spin up a separate instance for each request. We have used a mechanism of connecting to an existing browser and creating a new page in there. It can be visualized as opening yet another tab in browser which is closed right after a request is served. That helped a lot but also proved to bring some other issues to the table. It turned out that browser being an EventEmitter can handle up to 10 subscribers out of the box, so we had to increase that number, too. With its current setup it supports up to 1000 parallel requests and can be further increased if needed.
const ignoreHTTPSErrors = true; // ignore potential problems with SSL certificates and algorithms

// Store single instance to be able to reconnect to Chromium using `.wsEndpoint()`
const _sharedBrowser = puppeteer
  .launch({
    ignoreHTTPSErrors,
    headless: true,
    args: ['--no-sandbox', '--disable-setuid-sandbox'], // required by heroku buildpack
  })
  .then(browser => browser.setMaxListeners(1000)); // increase parallel connections limit (default is 10)

// Connect to a shared browser upon request

let _browser = null;

const tearDown = () => {
  // release the memory
  if (_browser) {
    _browser.disconnect();
    _browser = null;
  }
};

_sharedBrowser
  .then((browser) => {
    const browserWSEndpoint = browser.wsEndpoint();
    return puppeteer.connect({ browserWSEndpoint, ignoreHTTPSErrors });
  })
  .then((browser) => {
    _browser = browser;
    // do whatever you need to do
  })
  .then((data) => {
    tearDown();
    return data;
  })
  .catch((err) => {
    tearDown();
    throw err;
  });
Having a shared instance poses another thread: what if the node process dies? It will get restarted by Heroku, but browser won’t, as it’s not specified in Procfile. The browser should exit, too. To handle that we have added handling of interrupting signals to close the browser, so it can start from scratch after the restart.

Release memory like crazy
The situation was getting better but we had to make sure to release memory properly by always closing a page and disconnecting from the shared browser no matter what happens. We added a simple timeout after which the page is closed if the XHR request is not done. Additionally, we incorporated a mechanism to fail fast if Airtable doesn’t respond with a success response in the first place as most of the errors come from the fact that shared view is not really shared.

And this finally brought us to some stable state.
Pic.3. Before and after solution implementation.
Green line marks dynos restart after implementation.
Heroku dynos cycling
Being relatively sure that users could get their imports done, we let it run for a few days to monitor memory usage and it seemed like all the memory related issues were past us, but… we spotted some oddities in the metrics. Heroku restarts each dyno every 24 hours or so to keep our apps and their own infrastructure in a healthy condition. Dropped connections were piling up during peaks of highest usage and caused app crashes while booting. The solution was to use two dynos (Standard 1X) which are automatically restarted without overlap within a window of 216 minutes. Hence the traffic can be rerouted to a dyno that is not being restarted. That let us decrease dropped connections from hundreds to almost none.
Lessons learned
- Add-ons which seem “small and basic” may have some relatively serious business going on under the hood
- A request for tabular data can be more than 20 MB
- Headless Chrome is preferable to PhantomJS
- Don’t use the browser for server requests if possible, or prefer shared instance of it
- Use 2 mid-size Heroku dynos instead of 1 big one to leverage dyno cycling for uninterrupted services
- Monitor memory consumption over longer periods of time to spot leaks and fix them proactively.