RatePoint is an active, successful player in the competitive field of Internet marketing. It is hosted at 3 data centers, has 39 servers and includes about 10 internal and external services with their own configured environments to maximize performance.
24/7 high quality service is a major priority for RatePoint, which means that service should always be stable and reliable. Service stability can be achieved only with finely tuned monitoring and timely support. We use different services to monitor the system: NewRelic, WatchMouse, PingDom, ScoutApp.
To achieve a unified process of handling incoming notifications, we created a system named Notification Monitor. All notifications from services flows into separate mailboxes (rp_critical, rp_warning, rp_production, rp_staging), depending on the notification priority. The most important and urgent — those that need attention as soon as they appear — are directed to the rp_critical box. Notification Monitor Daemon processes them and alerts support in a few different ways.
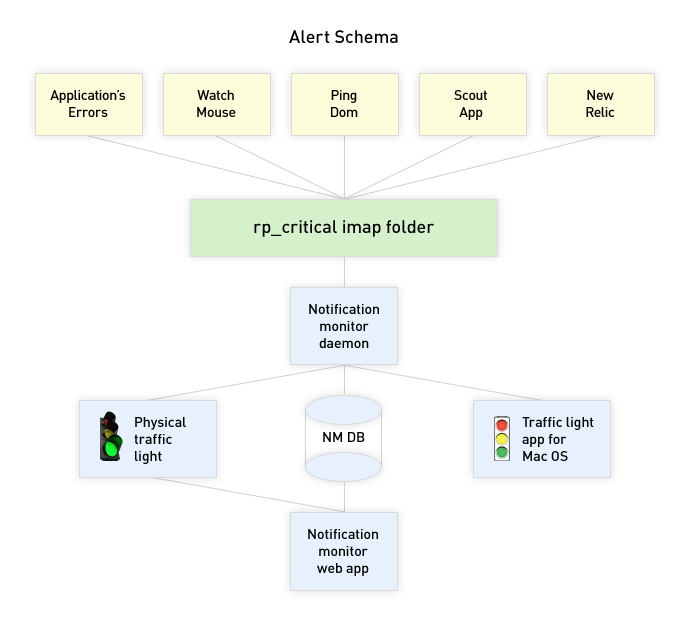
Let’s take a closer look at how it works. The system includes a Web application, a desktop utility, and a physical traffic light. The Web-based Rails application has two components: Notification Monitor Daemon and Notification Monitor Web.
Notification Monitor Daemon:
Every 10 seconds daemon checks the rp_critical box for unread messages. If there are such messages, it parses them to detect the type of message. If it detects an “alert/back to normal” message it puts it into the system with an “active” status and marks the message as “read.” If there are active notifications, daemon turns on the physical traffic light in the office. It will also turn off the traffic signal once a notification is assigned to or resolved by team members.
Notification Monitor Web:
We will show you in pictures :)
The system in the “Ok” state — no active notifications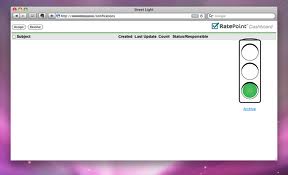
The system in the “Alert” state – siteseals.ratepoint.com is DOWN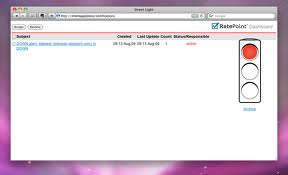
The system in the “in progress” state — skorolev has been assigned the task, “siteseals.ratepoint.com is UP” bind to the DOWN notification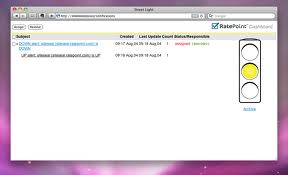
TrafficLight.app:
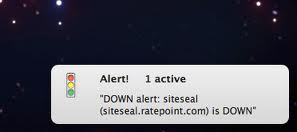
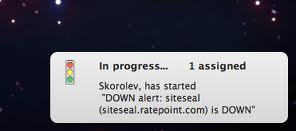
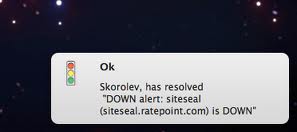
There is also desktop utility called TrafficLight.app, which displays the system’s status and issues an alert through the Growl notification if there is a change in status.
It works in an asynchronous mode, checking the system status once every 10 seconds. If the status has changed the Growl notification will provide details.


Physical traffic light:
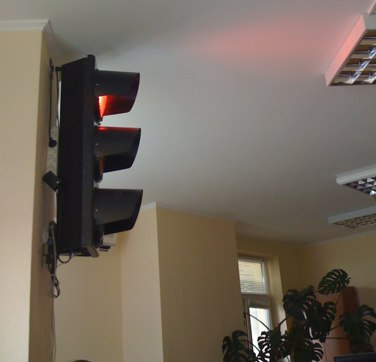
In the office we have a real traffic light that signals red when something happens, so alerts won’t be ignored!
Epilogue:
Notification Monitor takes away the need to constantly check the mailbox and lets the team concentrate on important innovations and new features.
